Analytics & insights
Analytics & insights
Surveys don't end when responses are submitted. Themistra's analytics help you understand what people answered, how strongly they felt, and where patterns begin to emerge — all without exporting data or learning complex tools.
The analytics page is designed to give you clarity at a glance, while still letting you dive deeper when needed.
See results question by question
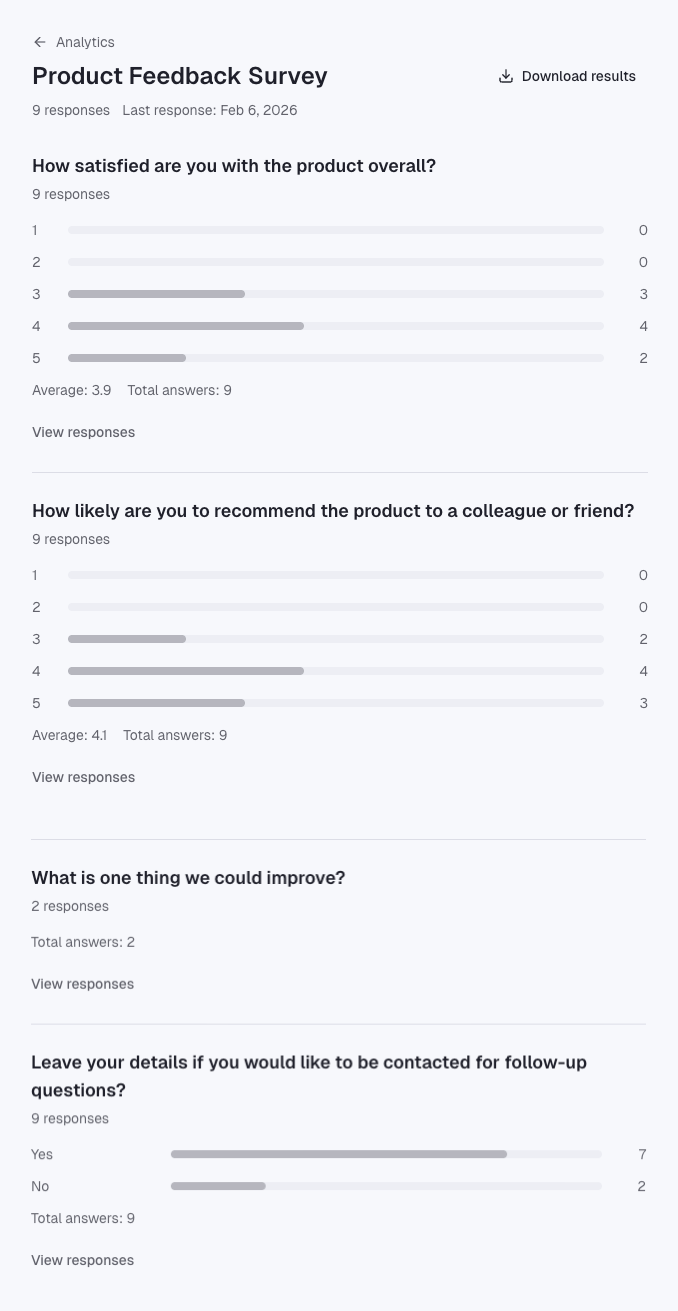
Each question is summarized individually, using a visualization that matches the question type.
For scale and rating questions, you’ll see:
- How responses are distributed across the scale
- The average score, calculated from all responses
- The total number of answers collected
For multiple choice questions, you’ll see:
- How often each option was selected
- Relative popularity between choices
- The total number of responses submitted
This makes it easy to spot trends, outliers, and strong signals without switching views.
Understand response volume and recency
At the top of the analytics page, you can quickly see:
- How many responses the survey has received
- When the most recent response was submitted
This helps you understand whether feedback is still coming in, slowing down, or complete.
Get notified the moment responses arrive
Enable email notifications to stay informed without checking constantly:
- Receive an email each time someone completes your survey
- See the total response count in the notification
- Click directly to your analytics dashboard
- Configure per survey with a custom email address
Perfect for time-sensitive research, event feedback, or staying responsive to your audience. Available on Professional and Enterprise plans.
Drill down when needed
For any question, you can open the full list of responses to:
- Read individual answers
- Review free-text feedback
- Validate patterns you’re seeing in the summary
High-level insights stay visible, but raw data is always one click away.
Built for clarity, not dashboards
Analytics in Themistra focus on answering real questions:
- What did people choose?
- How strong was their opinion?
- Where are responses clustering?
- What feedback needs attention?
There are no charts to configure and no reports to build. The structure of your survey defines the structure of your insights.
As your survey evolves, analytics update automatically — so you always see the current picture, not a snapshot from the past.
See your insights in real-time
Start collecting responses and watch analytics update automatically as data comes in.